EstuaryWatch Data Portal
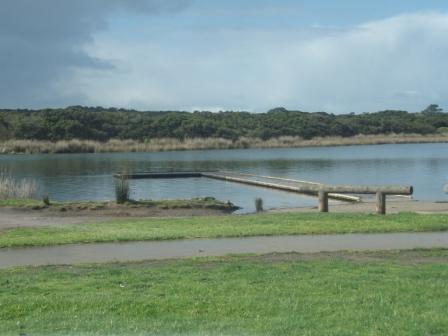
A1 Jetty opposite Angahook Corner Store
Site details
Overview
| Estuary | Anglesea River Estuary |
|---|---|
| CMA | Corangamite CMA |
| Type | Physico-Chemical |
| Site code | A1 |
| Site name | Jetty opposite Angahook Corner Store |
| Nearest road and town | Great Ocean Road, Anglesea |
| Description |
Sampling from Jetty opposite Minifie Avenue/ Angahook Cafe, adjacent to the information centre. |
| Site access |
Site accessed from carpark located beside the information centre. |
| Land use |
|
| Land use description |
High use recreational area, that seperates the estuary from the Great Ocean Road and a large residental area. |
| Status | Active |
| Observation history | 29-04-2007 - 18-12-2024 |
Site information |
|
Observations
Turbidity tubes do not measure below 9 NTU; Chart values of 9 should be interpreted as < 9 NTU
Observations
| Date | 21-02-2024 | 20-03-2024 | 17-04-2024 | 15-05-2024 | 19-06-2024 | 17-07-2024 | 21-08-2024 | 18-09-2024 | 16-10-2024 | 20-11-2024 | 18-12-2024 |
|---|---|---|---|---|---|---|---|---|---|---|---|
| Observation | #16028 | #16077 | #16132 | #16165 | #16209 | #16286 | #16379 | #16452 | #16513 | #16569 | #16624 |
Observation summaries
Turbidity NTU
| 21-02-2024 | 20-03-2024 | 17-04-2024 | 15-05-2024 | 19-06-2024 | 17-07-2024 | 21-08-2024 | 18-09-2024 | 16-10-2024 | 20-11-2024 | 18-12-2024 | |
|---|---|---|---|---|---|---|---|---|---|---|---|
| Top | 9.0 | 9.0 | 9.0 | 9.0 | 9.0 | 9.0 | 9.0 | 9.0 | 9.0 | 9.0 | 9.0 |
| Bottom | 9.0 | 9.0 | 9.0 | 9.0 | 9.0 | 9.0 | 9.0 | 9.0 | 9.0 | 9.0 | 9.0 |
pH
| 21-02-2024 | 20-03-2024 | 17-04-2024 | 15-05-2024 | 19-06-2024 | 17-07-2024 | 21-08-2024 | 18-09-2024 | 16-10-2024 | 20-11-2024 | 18-12-2024 | |
|---|---|---|---|---|---|---|---|---|---|---|---|
| Top | 7.1 | 7.1 | 7.3 | 7.5 | 4.8 | 7.5 | 7.4 | 7.3 | 7.9 | 8.2 | |
| Bottom | 7.5 | 6.9 | 7.2 | 7.9 | 6.6 | 7.8 | 7.9 | 7.7 | 8.0 | 8.2 |
Ammonia mg/L
| 21-02-2024 | 20-03-2024 | 17-04-2024 | 15-05-2024 | 19-06-2024 | 17-07-2024 | 21-08-2024 | 18-09-2024 | 16-10-2024 | 20-11-2024 | 18-12-2024 | |
|---|---|---|---|---|---|---|---|---|---|---|---|
| Top | |||||||||||
| Bottom |
Enterococci orgs/100mL
| 21-02-2024 | 20-03-2024 | 17-04-2024 | 15-05-2024 | 19-06-2024 | 17-07-2024 | 21-08-2024 | 18-09-2024 | 16-10-2024 | 20-11-2024 | 18-12-2024 | |
|---|---|---|---|---|---|---|---|---|---|---|---|
| Top | |||||||||||
| Bottom |
Temperature ° C
| 21-02-2024 | 20-03-2024 | 17-04-2024 | 15-05-2024 | 19-06-2024 | 17-07-2024 | 21-08-2024 | 18-09-2024 | 16-10-2024 | 20-11-2024 | 18-12-2024 | |
|---|---|---|---|---|---|---|---|---|---|---|---|
| Top | 20.70 | 18.10 | 14.60 | 11.70 | 8.70 | 11.60 | 12.40 | 10.20 | 18.00 | 16.20 | 20.90 |
| Bottom | 20.60 | 18.30 | 14.60 | 11.60 | 8.60 | 11.40 | 12.40 | 12.10 | 18.20 | 16.40 | 21.00 |
Salinity ppt
| 21-02-2024 | 20-03-2024 | 17-04-2024 | 15-05-2024 | 19-06-2024 | 17-07-2024 | 21-08-2024 | 18-09-2024 | 16-10-2024 | 20-11-2024 | 18-12-2024 | |
|---|---|---|---|---|---|---|---|---|---|---|---|
| Top | |||||||||||
| Bottom |
D.O. mg/L
| 21-02-2024 | 20-03-2024 | 17-04-2024 | 15-05-2024 | 19-06-2024 | 17-07-2024 | 21-08-2024 | 18-09-2024 | 16-10-2024 | 20-11-2024 | 18-12-2024 | |
|---|---|---|---|---|---|---|---|---|---|---|---|
| Top | 6.11 | 6.23 | 8.58 | 8.39 | 9.70 | 9.54 | 8.97 | 9.74 | 7.95 | 7.91 | 7.76 |
| Bottom | 5.97 | 6.16 | 8.23 | 8.34 | 9.65 | 9.63 | 8.80 | 9.60 | 7.71 | 7.83 | 7.91 |
D.O. % Sat
| 21-02-2024 | 20-03-2024 | 17-04-2024 | 15-05-2024 | 19-06-2024 | 17-07-2024 | 21-08-2024 | 18-09-2024 | 16-10-2024 | 20-11-2024 | 18-12-2024 | |
|---|---|---|---|---|---|---|---|---|---|---|---|
| Top | 78.50 | 76.70 | 97.10 | 87.60 | 95.50 | 97.50 | 92.20 | 99.40 | 93.90 | 90.50 | 95.90 |
| Bottom | 76.30 | 75.90 | 92.90 | 86.90 | 94.40 | 98.20 | 91.30 | 97.60 | 90.70 | 89.40 | 97.70 |
Conductivity mS/cm
| 21-02-2024 | 20-03-2024 | 17-04-2024 | 15-05-2024 | 19-06-2024 | 17-07-2024 | 21-08-2024 | 18-09-2024 | 16-10-2024 | 20-11-2024 | 18-12-2024 | |
|---|---|---|---|---|---|---|---|---|---|---|---|
| Top | 38.02 | 38.66 | 35.57 | 32.01 | 32.72 | 27.82 | 23.93 | 23.10 | 28.07 | 29.23 | 26.91 |
| Bottom | 37.93 | 38.73 | 35.49 | 32.01 | 32.69 | 27.89 | 23.91 | 23.12 | 28.10 | 29.21 | 27.00 |

All content, files, data and images provided by the EstuaryWatch Data Portal and Gallery are subject to a Creative Commons Attribution License
Content is made available to be used in any way, and should always attribute EstuaryWatch and www.estuarywatch.org.au