EstuaryWatch Data Portal
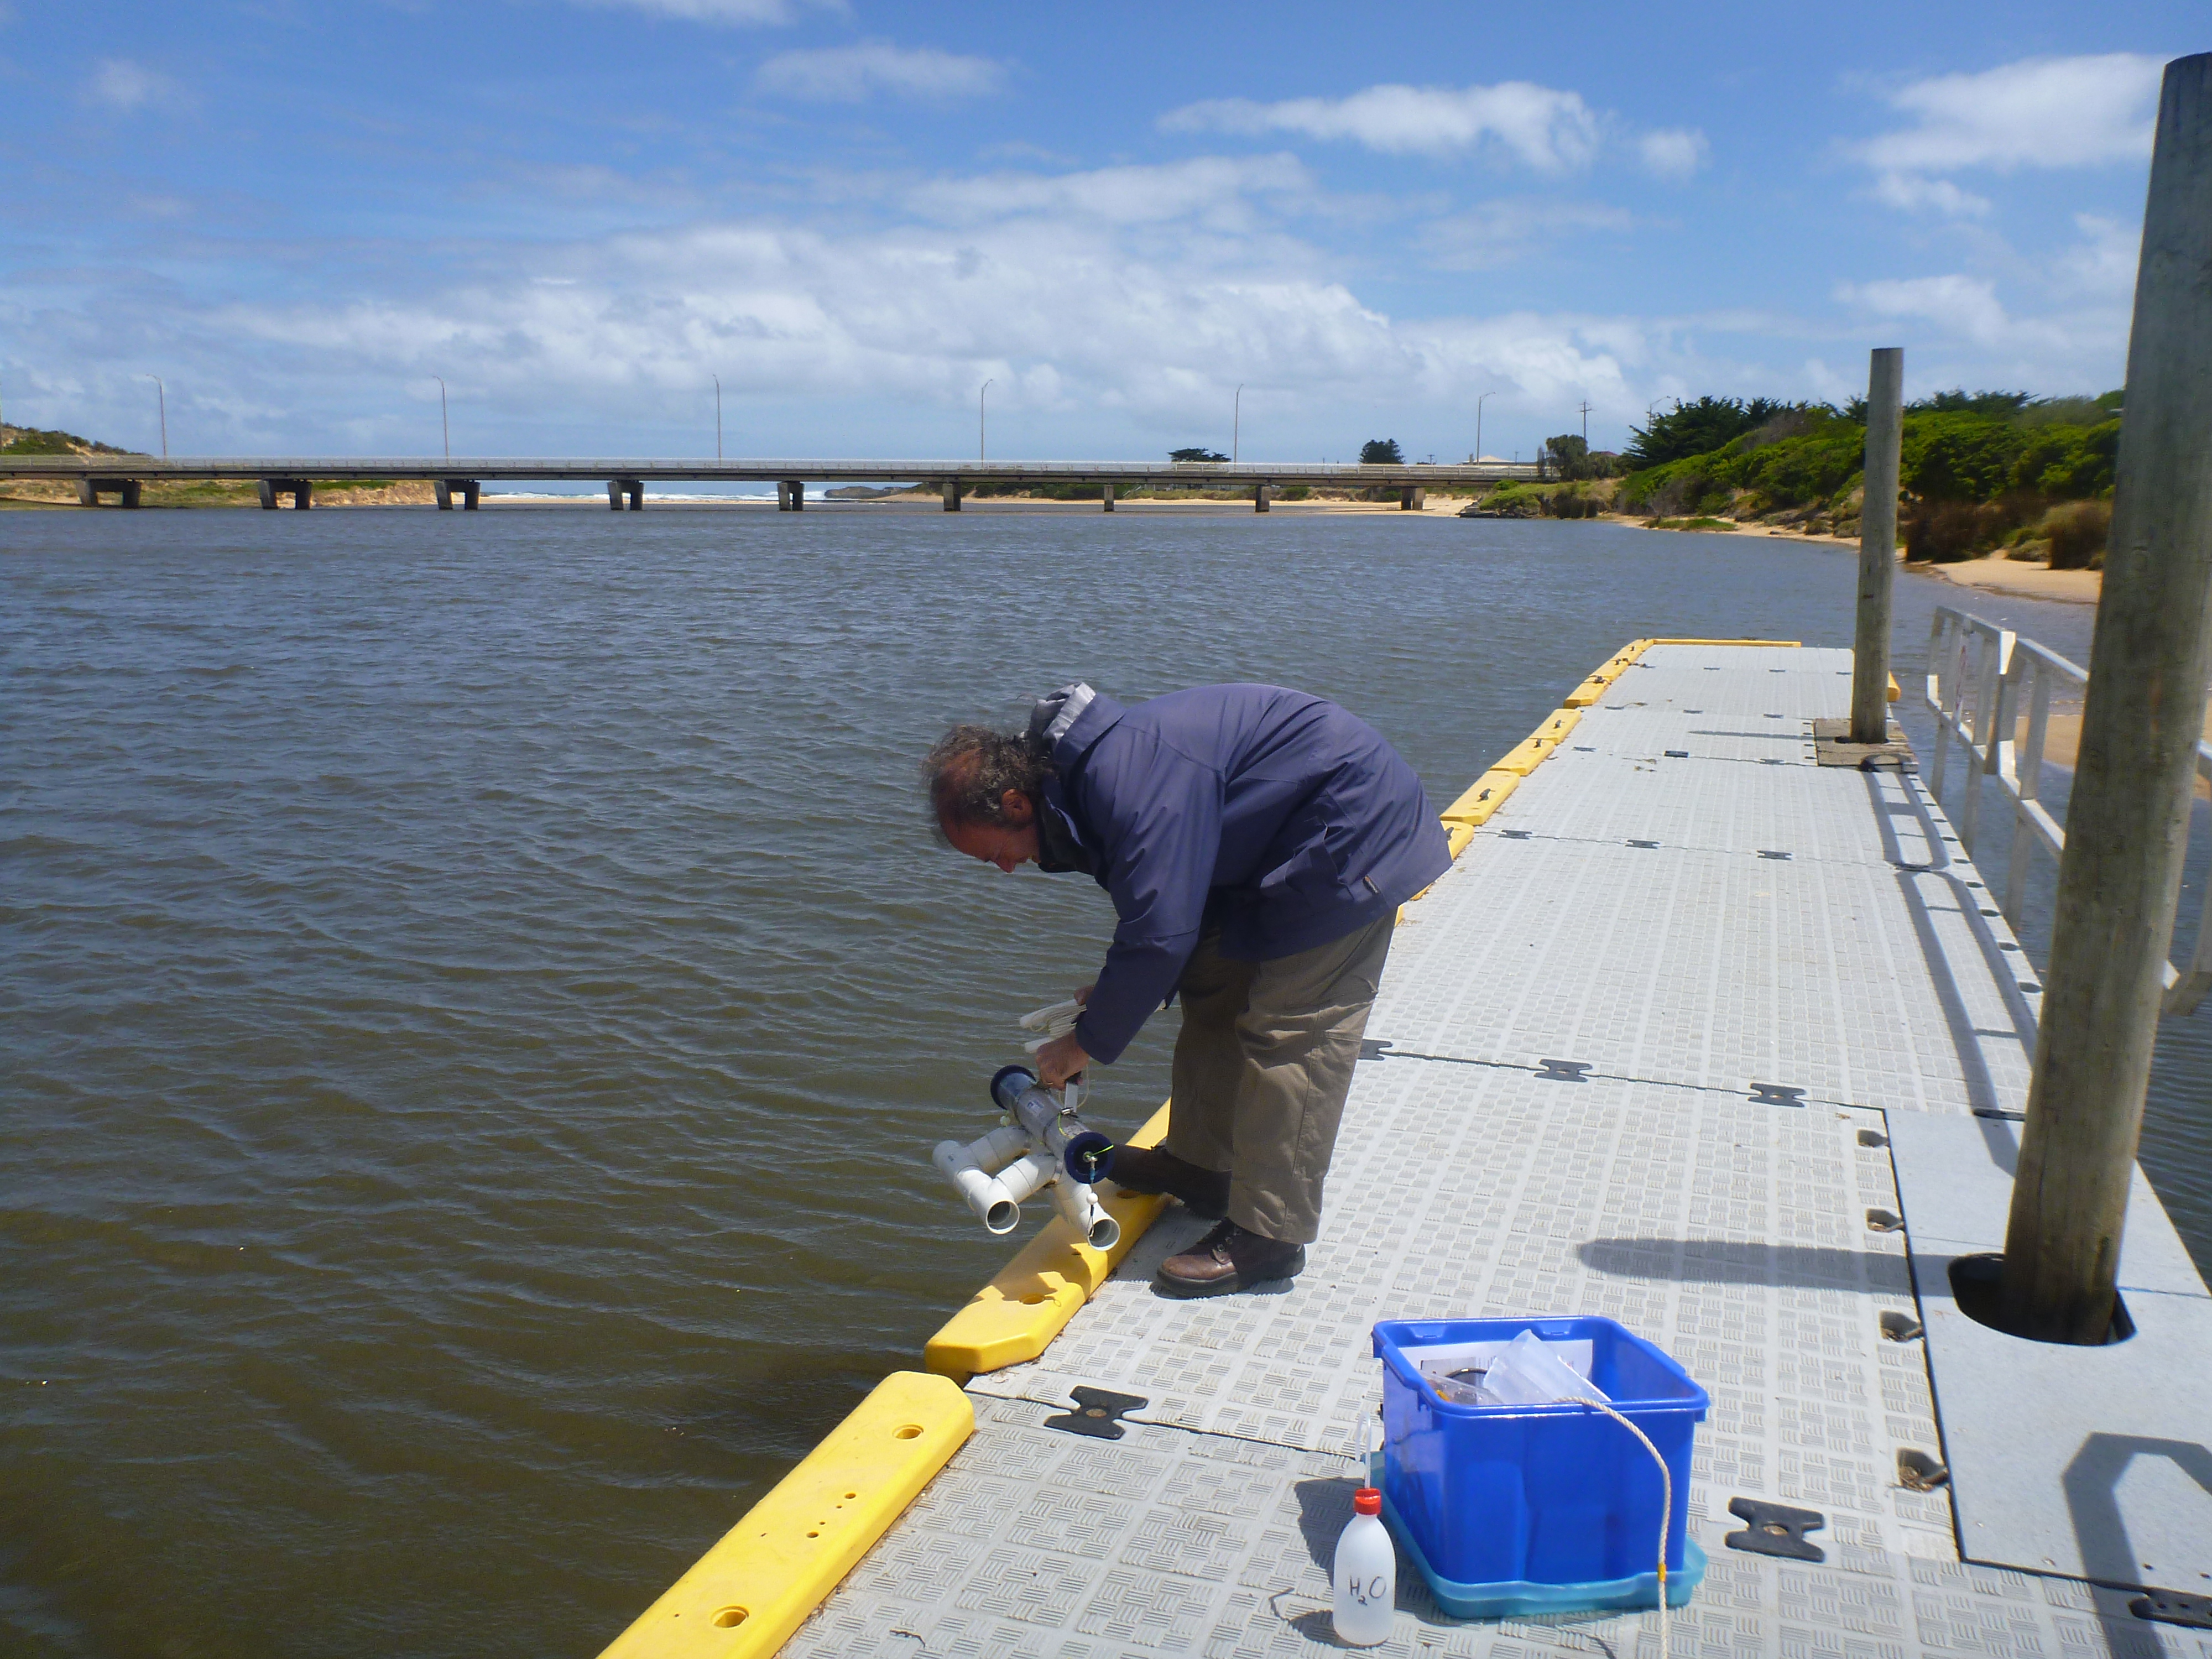
Cu1 Dorey Street floating pontoon
Site details
Overview
| Estuary | Curdies River Estuary |
|---|---|
| CMA | Corangamite CMA |
| Type | Physico-Chemical |
| Site code | Cu1 |
| Site name | Dorey Street floating pontoon |
| Nearest road and town | Dorey Street, Peterborough |
| Description | Floating pontoon at the end of Dorey Street, Peterborough. The floating pontoon is next to the Curdies River boat ramp. Monitoring is conducted in front of the first wooden pylon on the floating jetty. |
| Site access | When travelling from Port Campbell on the Great Ocean Road, turn right into Irvine Street, Peterborough after crossing the Curdies River bridge, then turn right into Dorey Street and follow to the end. |
| Land use |
|
| Land use description | Adjacent to the floating pontoon is a boat ramp, rural residential and a car park. |
| Status | Active |
| Observation history | 11-12-2013 - 07-01-2025 |
Dorey Street floating pontoon |
|
Observations
Turbidity tubes do not measure below 9 NTU; Chart values of 9 should be interpreted as < 9 NTU
Observations
| Date | 06-02-2024 | 05-03-2024 | 02-04-2024 | 07-05-2024 | 04-06-2024 | 02-07-2024 | 06-08-2024 | 01-10-2024 | 05-11-2024 | 03-12-2024 | 07-01-2025 |
|---|---|---|---|---|---|---|---|---|---|---|---|
| Observation | #15998 | #16041 | #16086 | #16155 | #16196 | #16238 | #16345 | #16468 | #16533 | #16597 | #16636 |
Observation summaries
Turbidity NTU
| 06-02-2024 | 05-03-2024 | 02-04-2024 | 07-05-2024 | 04-06-2024 | 02-07-2024 | 06-08-2024 | 01-10-2024 | 05-11-2024 | 03-12-2024 | 07-01-2025 | |
|---|---|---|---|---|---|---|---|---|---|---|---|
| Top | 9.0 | 27.0 | 90.0 | 65.0 | 80.0 | 90.0 | 52.0 | 11.5 | 9.0 | 9.0 | |
| Bottom | 9.0 | 13.0 | 100.0 | 50.0 | 60.0 | 70.0 | 60.0 | 9.0 | 9.0 | 9.0 |
pH
| 06-02-2024 | 05-03-2024 | 02-04-2024 | 07-05-2024 | 04-06-2024 | 02-07-2024 | 06-08-2024 | 01-10-2024 | 05-11-2024 | 03-12-2024 | 07-01-2025 | |
|---|---|---|---|---|---|---|---|---|---|---|---|
| Top | 9.1 | 9.2 | 9.5 | 9.2 | 9.0 | 8.4 | 8.8 | 7.9 | 7.9 | 8.0 | |
| Bottom | 9.1 | 9.2 | 9.1 | 9.2 | 9.0 | 8.6 | 9.0 | 8.2 | 7.9 | 8.2 |
Ammonia mg/L
| 06-02-2024 | 05-03-2024 | 02-04-2024 | 07-05-2024 | 04-06-2024 | 02-07-2024 | 06-08-2024 | 01-10-2024 | 05-11-2024 | 03-12-2024 | 07-01-2025 | |
|---|---|---|---|---|---|---|---|---|---|---|---|
| Top | |||||||||||
| Bottom |
Enterococci orgs/100mL
| 06-02-2024 | 05-03-2024 | 02-04-2024 | 07-05-2024 | 04-06-2024 | 02-07-2024 | 06-08-2024 | 01-10-2024 | 05-11-2024 | 03-12-2024 | 07-01-2025 | |
|---|---|---|---|---|---|---|---|---|---|---|---|
| Top | |||||||||||
| Bottom |
Temperature ° C
| 06-02-2024 | 05-03-2024 | 02-04-2024 | 07-05-2024 | 04-06-2024 | 02-07-2024 | 06-08-2024 | 01-10-2024 | 05-11-2024 | 03-12-2024 | 07-01-2025 | |
|---|---|---|---|---|---|---|---|---|---|---|---|
| Top | 20.70 | 17.50 | 17.70 | 13.50 | 10.80 | 8.90 | 9.80 | 14.60 | 14.70 | 20.80 | 16.80 |
| Bottom | 20.40 | 17.10 | 17.70 | 13.20 | 10.60 | 8.90 | 9.60 | 14.40 | 15.50 | 18.80 | 16.60 |
Salinity ppt
| 06-02-2024 | 05-03-2024 | 02-04-2024 | 07-05-2024 | 04-06-2024 | 02-07-2024 | 06-08-2024 | 01-10-2024 | 05-11-2024 | 03-12-2024 | 07-01-2025 | |
|---|---|---|---|---|---|---|---|---|---|---|---|
| Top | 11.60 | 13.90 | 14.60 | 14.70 | 14.90 | 14.60 | 10.90 | 28.80 | 33.40 | 37.90 | |
| Bottom | 11.70 | 14.20 | 14.60 | 14.80 | 15.00 | 14.60 | 11.50 | 37.90 | 38.60 | 39.70 | 38.10 |
D.O. mg/L
| 06-02-2024 | 05-03-2024 | 02-04-2024 | 07-05-2024 | 04-06-2024 | 02-07-2024 | 06-08-2024 | 01-10-2024 | 05-11-2024 | 03-12-2024 | 07-01-2025 | |
|---|---|---|---|---|---|---|---|---|---|---|---|
| Top | 8.17 | 8.49 | 4.77 | 10.94 | 10.58 | 11.30 | 14.37 | 10.57 | 9.42 | 6.04 | 7.80 |
| Bottom | 7.66 | 6.91 | 6.32 | 5.77 | 10.29 | 12.15 | 14.85 | 10.74 | 9.14 | 7.17 | 7.43 |
D.O. % Sat
| 06-02-2024 | 05-03-2024 | 02-04-2024 | 07-05-2024 | 04-06-2024 | 02-07-2024 | 06-08-2024 | 01-10-2024 | 05-11-2024 | 03-12-2024 | 07-01-2025 | |
|---|---|---|---|---|---|---|---|---|---|---|---|
| Top | 90.50 | 88.60 | 50.10 | 104.80 | 95.30 | 102.00 | 126.10 | 103.60 | 93.00 | 69.20 | 80.00 |
| Bottom | 82.10 | 71.20 | 66.10 | 54.30 | 92.20 | 102.90 | 122.70 | 104.20 | 91.80 | 78.60 | 75.70 |
Conductivity mS/cm
| 06-02-2024 | 05-03-2024 | 02-04-2024 | 07-05-2024 | 04-06-2024 | 02-07-2024 | 06-08-2024 | 01-10-2024 | 05-11-2024 | 03-12-2024 | 07-01-2025 | |
|---|---|---|---|---|---|---|---|---|---|---|---|
| Top | 17.81 | 19.65 | 20.64 | 18.82 | 17.92 | 16.68 | 13.08 | 35.80 | 46.70 | 48.00 | |
| Bottom | 17.83 | 19.81 | 20.67 | 18.87 | 17.90 | 16.68 | 13.69 | 54.10 | 55.20 | 52.20 | 48.00 |

All content, files, data and images provided by the EstuaryWatch Data Portal and Gallery are subject to a Creative Commons Attribution License
Content is made available to be used in any way, and should always attribute EstuaryWatch and www.estuarywatch.org.au