EstuaryWatch Data Portal
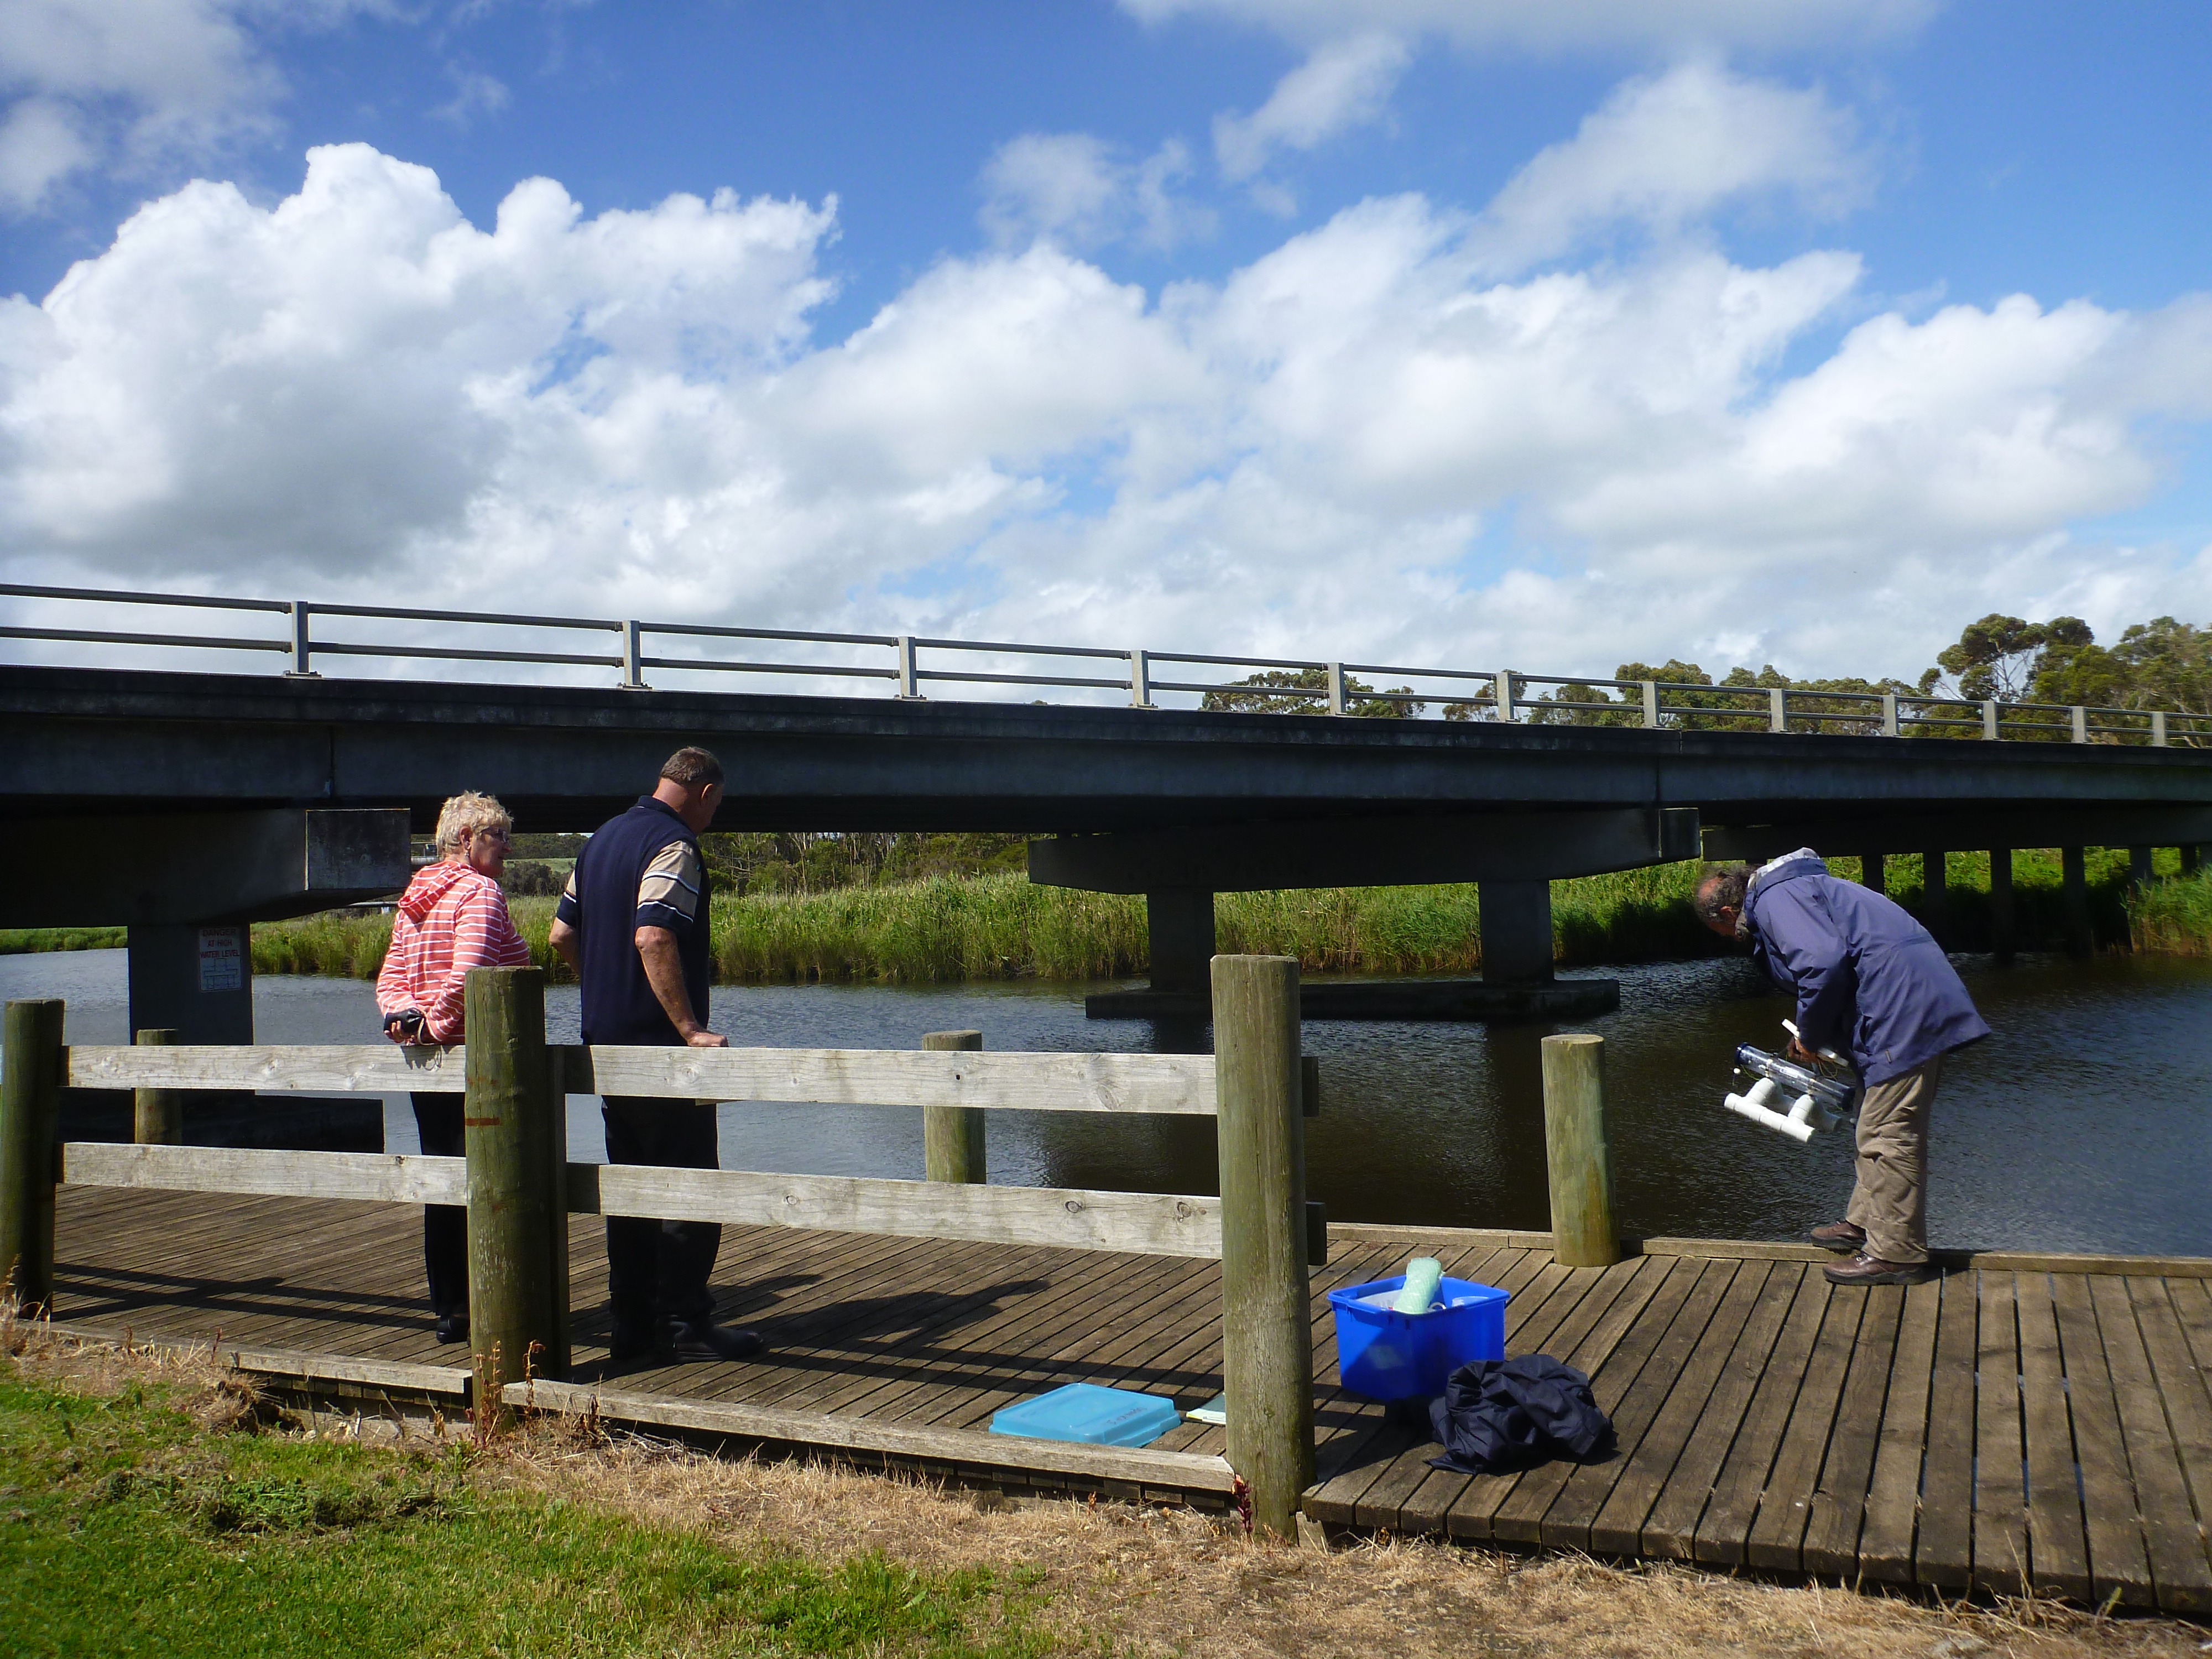
Cu2 Boggy Creek Road fishing jetty
Site details
Overview
| Estuary | Curdies River Estuary |
|---|---|
| CMA | Corangamite CMA |
| Type | Physico-Chemical |
| Site code | Cu2 |
| Site name | Boggy Creek Road fishing jetty |
| Nearest road and town | Boggy Creek Road, Curdievale |
| Description | Fishing jetty downstream of Boggy Creek Rd bridge, Curdievale. Monitoring is conducted in front of the fish ruler. |
| Site access | If travelling from Peterborough, take the great Ocean Road towards Warrnambool. Turn right at Boggy Creek Road. Park in front of the jetty downstream of the bridge. |
| Land use |
|
| Land use description | |
| Status | Active |
| Observation history | 11-12-2013 - 07-01-2025 |
Boggy Creek Road fishing jetty |
|
Observations
Turbidity tubes do not measure below 9 NTU; Chart values of 9 should be interpreted as < 9 NTU
Observations
| Date | 06-02-2024 | 05-03-2024 | 02-04-2024 | 07-05-2024 | 04-06-2024 | 02-07-2024 | 01-10-2024 | 05-11-2024 | 03-12-2024 | 07-01-2025 |
|---|---|---|---|---|---|---|---|---|---|---|
| Observation | #15999 | #16042 | #16085 | #16156 | #16197 | #16239 | #16470 | #16534 | #16598 | #16637 |
Observation summaries
Turbidity NTU
| 06-02-2024 | 05-03-2024 | 02-04-2024 | 07-05-2024 | 04-06-2024 | 02-07-2024 | 01-10-2024 | 05-11-2024 | 03-12-2024 | 07-01-2025 | |
|---|---|---|---|---|---|---|---|---|---|---|
| Top | 9.0 | 11.0 | 9.0 | 15.0 | 11.0 | 19.0 | 15.0 | 21.0 | 9.0 | 9.0 |
| Bottom | 9.0 | 9.0 | 9.0 | 13.0 | 14.0 | 27.0 | 15.0 | 22.0 | 9.0 | 9.0 |
pH
| 06-02-2024 | 05-03-2024 | 02-04-2024 | 07-05-2024 | 04-06-2024 | 02-07-2024 | 01-10-2024 | 05-11-2024 | 03-12-2024 | 07-01-2025 | |
|---|---|---|---|---|---|---|---|---|---|---|
| Top | 8.3 | 8.3 | 8.2 | 8.4 | 8.3 | 8.1 | 7.9 | 8.5 | 8.0 | 8.5 |
| Bottom | 8.3 | 8.0 | 8.2 | 8.4 | 8.4 | 8.1 | 7.6 | 8.4 | 7.8 | 8.5 |
Ammonia mg/L
| 06-02-2024 | 05-03-2024 | 02-04-2024 | 07-05-2024 | 04-06-2024 | 02-07-2024 | 01-10-2024 | 05-11-2024 | 03-12-2024 | 07-01-2025 | |
|---|---|---|---|---|---|---|---|---|---|---|
| Top | ||||||||||
| Bottom |
Enterococci orgs/100mL
| 06-02-2024 | 05-03-2024 | 02-04-2024 | 07-05-2024 | 04-06-2024 | 02-07-2024 | 01-10-2024 | 05-11-2024 | 03-12-2024 | 07-01-2025 | |
|---|---|---|---|---|---|---|---|---|---|---|
| Top | ||||||||||
| Bottom |
Temperature ° C
| 06-02-2024 | 05-03-2024 | 02-04-2024 | 07-05-2024 | 04-06-2024 | 02-07-2024 | 01-10-2024 | 05-11-2024 | 03-12-2024 | 07-01-2025 | |
|---|---|---|---|---|---|---|---|---|---|---|
| Top | 22.20 | 19.80 | 18.60 | 14.10 | 11.50 | 9.50 | 18.50 | 19.00 | 23.60 | 20.40 |
| Bottom | 22.70 | 19.60 | 18.90 | 15.20 | 12.10 | 10.00 | 14.60 | 18.80 | 21.30 | 20.60 |
Salinity ppt
| 06-02-2024 | 05-03-2024 | 02-04-2024 | 07-05-2024 | 04-06-2024 | 02-07-2024 | 01-10-2024 | 05-11-2024 | 03-12-2024 | 07-01-2025 | |
|---|---|---|---|---|---|---|---|---|---|---|
| Top | 6.40 | 8.80 | 10.70 | 8.20 | 9.70 | 1.30 | 9.30 | 8.60 | 26.00 | |
| Bottom | 8.00 | 9.20 | 12.00 | 11.80 | 13.10 | 1.50 | 18.80 | 26.00 | 25.90 |
D.O. mg/L
| 06-02-2024 | 05-03-2024 | 02-04-2024 | 07-05-2024 | 04-06-2024 | 02-07-2024 | 01-10-2024 | 05-11-2024 | 03-12-2024 | 07-01-2025 | |
|---|---|---|---|---|---|---|---|---|---|---|
| Top | 7.46 | 6.89 | 63.90 | 10.60 | 7.90 | 11.23 | 5.06 | 11.54 | 8.21 | 8.38 |
| Bottom | 5.92 | 6.69 | 59.40 | 3.75 | 4.67 | 8.04 | 3.80 | 8.58 | 0.12 | 8.13 |
D.O. % Sat
| 06-02-2024 | 05-03-2024 | 02-04-2024 | 07-05-2024 | 04-06-2024 | 02-07-2024 | 01-10-2024 | 05-11-2024 | 03-12-2024 | 07-01-2025 | |
|---|---|---|---|---|---|---|---|---|---|---|
| Top | 84.90 | 76.30 | 6.02 | 102.50 | 72.30 | 96.00 | 50.60 | 125.70 | 98.90 | 92.00 |
| Bottom | 67.90 | 72.80 | 5.52 | 37.10 | 43.40 | 70.00 | 37.20 | 92.90 | 1.40 | 90.00 |
Conductivity mS/cm
| 06-02-2024 | 05-03-2024 | 02-04-2024 | 07-05-2024 | 04-06-2024 | 02-07-2024 | 01-10-2024 | 05-11-2024 | 03-12-2024 | 07-01-2025 | |
|---|---|---|---|---|---|---|---|---|---|---|
| Top | 10.62 | 13.56 | 15.78 | 11.16 | 12.21 | 11.00 | 1.80 | 14.08 | 14.33 | 37.00 |
| Bottom | 13.26 | 14.11 | 17.73 | 16.05 | 16.39 | 15.26 | 2.15 | 26.70 | 37.70 | 37.00 |

All content, files, data and images provided by the EstuaryWatch Data Portal and Gallery are subject to a Creative Commons Attribution License
Content is made available to be used in any way, and should always attribute EstuaryWatch and www.estuarywatch.org.au