EstuaryWatch Data Portal
H1 Site one (Hopkins River Bridge)
Site details
Overview
| Estuary | Hopkins River Estuary |
|---|---|
| CMA | Glenelg Hopkins CMA |
| Type | Physico-Chemical |
| Site code | H1 |
| Site name | Site one (Hopkins River Bridge) |
| Nearest road and town | Hopkins Point Road, Warrnambool |
| Description | Ocean side of bridge, between the 29th and 30th post (counting from the western side of bridge) infront of the fishing ruler. |
| Site access | Park in the carpark located on the eastern side of the bridge. |
| Land use |
|
| Land use description | Coastal reserve on downstream side of bridge, and urban residential on upstream side of bridge. |
| Status | Active |
| Observation history | 01-01-2000 - 17-01-2025 |
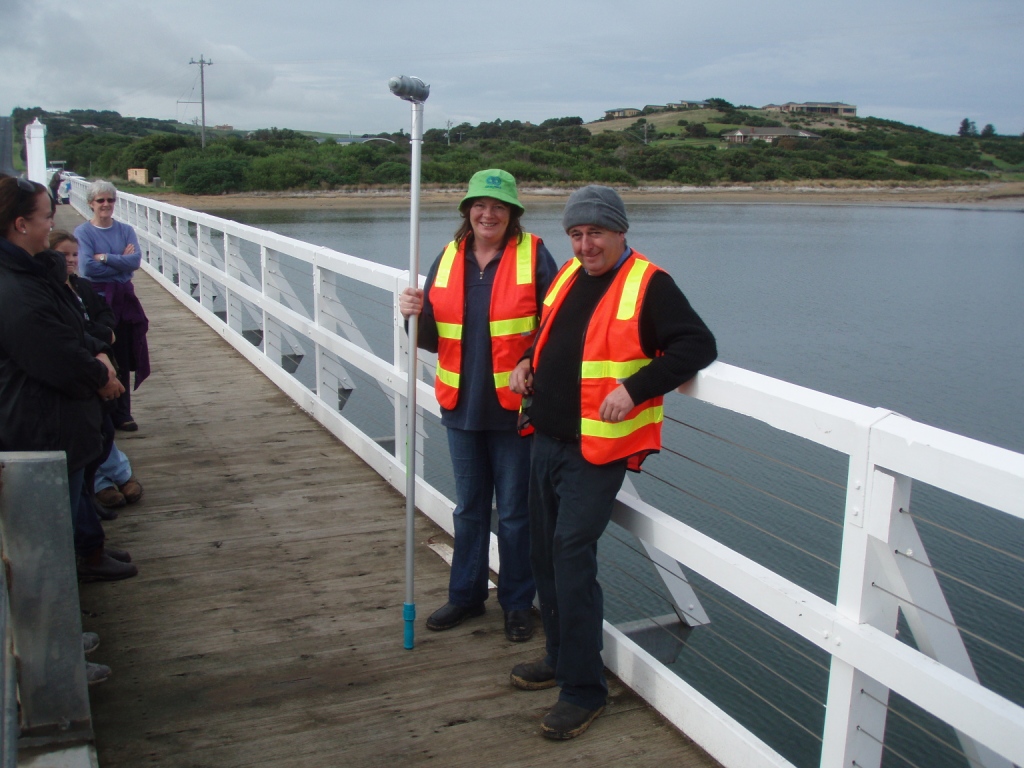
Volunteers at site one. |
|
Observations
Turbidity tubes do not measure below 9 NTU; Chart values of 9 should be interpreted as < 9 NTU
Observations
| Date | 16-02-2024 | 15-03-2024 | 20-04-2024 | 25-05-2024 | 22-06-2024 | 21-07-2024 | 17-08-2024 | 21-09-2024 | 21-10-2024 | 15-11-2024 | 13-12-2024 | 17-01-2025 |
|---|---|---|---|---|---|---|---|---|---|---|---|---|
| Observation | #16016 | #16054 | #16120 | #16182 | #16222 | #16329 | #16370 | #16448 | #16519 | #16556 | #16610 | #16658 |
Observation summaries
Turbidity NTU
| 16-02-2024 | 15-03-2024 | 20-04-2024 | 25-05-2024 | 22-06-2024 | 21-07-2024 | 17-08-2024 | 21-09-2024 | 21-10-2024 | 15-11-2024 | 13-12-2024 | 17-01-2025 | |
|---|---|---|---|---|---|---|---|---|---|---|---|---|
| Top | 9.0 | 9.0 | 9.0 | 9.0 | 9.0 | 9.0 | 9.0 | 9.0 | 9.0 | 9.0 | 9.0 | 9.0 |
| Bottom | 9.0 | 17.0 | 9.0 | 9.0 | 9.0 | 9.0 | 9.0 | 9.0 | 9.0 | 9.0 | 9.0 | 9.0 |
pH
| 16-02-2024 | 15-03-2024 | 20-04-2024 | 25-05-2024 | 22-06-2024 | 21-07-2024 | 17-08-2024 | 21-09-2024 | 21-10-2024 | 15-11-2024 | 13-12-2024 | 17-01-2025 | |
|---|---|---|---|---|---|---|---|---|---|---|---|---|
| Top | 7.0 | 8.0 | 7.5 | 8.3 | 8.4 | 8.2 | 8.3 | 7.8 | 8.6 | 8.1 | 8.1 | 8.0 |
| Bottom | 6.9 | 8.0 | 7.5 | 7.7 | 8.0 | 7.9 | 8.0 | 7.9 | 8.2 | 7.8 | 7.7 | 7.7 |
Ammonia mg/L
| 16-02-2024 | 15-03-2024 | 20-04-2024 | 25-05-2024 | 22-06-2024 | 21-07-2024 | 17-08-2024 | 21-09-2024 | 21-10-2024 | 15-11-2024 | 13-12-2024 | 17-01-2025 | |
|---|---|---|---|---|---|---|---|---|---|---|---|---|
| Top | ||||||||||||
| Bottom |
Enterococci orgs/100mL
| 16-02-2024 | 15-03-2024 | 20-04-2024 | 25-05-2024 | 22-06-2024 | 21-07-2024 | 17-08-2024 | 21-09-2024 | 21-10-2024 | 15-11-2024 | 13-12-2024 | 17-01-2025 | |
|---|---|---|---|---|---|---|---|---|---|---|---|---|
| Top | ||||||||||||
| Bottom |
Temperature ° C
| 16-02-2024 | 15-03-2024 | 20-04-2024 | 25-05-2024 | 22-06-2024 | 21-07-2024 | 17-08-2024 | 21-09-2024 | 21-10-2024 | 15-11-2024 | 13-12-2024 | 17-01-2025 | |
|---|---|---|---|---|---|---|---|---|---|---|---|---|
| Top | 21.50 | 21.00 | 16.20 | 12.80 | 11.20 | 11.90 | 14.70 | 13.60 | 19.90 | 20.10 | 21.80 | 23.40 |
| Bottom | 18.90 | 19.70 | 16.30 | 15.20 | 12.90 | 12.60 | 14.00 | 13.40 | 16.30 | 18.10 | 20.20 | 23.20 |
Salinity ppt
| 16-02-2024 | 15-03-2024 | 20-04-2024 | 25-05-2024 | 22-06-2024 | 21-07-2024 | 17-08-2024 | 21-09-2024 | 21-10-2024 | 15-11-2024 | 13-12-2024 | 17-01-2025 | |
|---|---|---|---|---|---|---|---|---|---|---|---|---|
| Top | 17.90 | 20.10 | 13.80 | 8.00 | 7.30 | 12.20 | 11.60 | 15.80 | 8.90 | 9.90 | 12.70 | 10.00 |
| Bottom | 33.00 | 21.40 | 17.30 | 26.50 | 26.80 | 30.20 | 29.10 | 26.70 | 27.70 | 23.70 | 22.80 | 10.00 |
D.O. mg/L
| 16-02-2024 | 15-03-2024 | 20-04-2024 | 25-05-2024 | 22-06-2024 | 21-07-2024 | 17-08-2024 | 21-09-2024 | 21-10-2024 | 15-11-2024 | 13-12-2024 | 17-01-2025 | |
|---|---|---|---|---|---|---|---|---|---|---|---|---|
| Top | 9.49 | 6.97 | 9.38 | 10.63 | 11.09 | 9.64 | 10.82 | 9.40 | 9.51 | 8.57 | 8.00 | 8.03 |
| Bottom | 0.22 | 1.17 | 5.87 | 1.85 | 6.62 | 8.47 | 5.52 | 7.81 | 6.45 | 0.97 | 0.36 | 7.48 |
D.O. % Sat
| 16-02-2024 | 15-03-2024 | 20-04-2024 | 25-05-2024 | 22-06-2024 | 21-07-2024 | 17-08-2024 | 21-09-2024 | 21-10-2024 | 15-11-2024 | 13-12-2024 | 17-01-2025 | |
|---|---|---|---|---|---|---|---|---|---|---|---|---|
| Top | 106.80 | 86.50 | 102.10 | 104.10 | 104.10 | 96.10 | 115.10 | 100.30 | 109.50 | 99.80 | 98.30 | 99.10 |
| Bottom | 2.80 | 10.60 | 65.10 | 20.70 | 72.70 | 95.90 | 63.30 | 88.40 | 75.30 | 11.70 | 4.80 | 91.70 |
Conductivity mS/cm
| 16-02-2024 | 15-03-2024 | 20-04-2024 | 25-05-2024 | 22-06-2024 | 21-07-2024 | 17-08-2024 | 21-09-2024 | 21-10-2024 | 15-11-2024 | 13-12-2024 | 17-01-2025 | |
|---|---|---|---|---|---|---|---|---|---|---|---|---|
| Top | 28.95 | 32.16 | 22.78 | 13.70 | 12.75 | 20.41 | 19.34 | 25.90 | 15.06 | 16.81 | 21.21 | 17.00 |
| Bottom | 50.20 | 34.10 | 28.04 | 41.12 | 41.79 | 46.56 | 45.04 | 41.71 | 43.19 | 37.28 | 36.21 | 17.04 |

All content, files, data and images provided by the EstuaryWatch Data Portal and Gallery are subject to a Creative Commons Attribution License
Content is made available to be used in any way, and should always attribute EstuaryWatch and www.estuarywatch.org.au