EstuaryWatch Data Portal
H2 Site two (Riverboat Cruise Pontoon)
Site details
Overview
| Estuary | Hopkins River Estuary |
|---|---|
| CMA | Glenelg Hopkins CMA |
| Type | Physico-Chemical |
| Site code | H2 |
| Site name | Site two (Riverboat Cruise Pontoon) |
| Nearest road and town | Simpson Street, Warrnambool |
| Description | Pontoon located on the ocean side of the Riverboat. This pontoon extends out into the river beyond the other pontoons. |
| Site access | Access via the boat ramp carpark located on Simpson Street . |
| Land use |
|
| Land use description | This site is located adjacent to the boat ramp carpark. Bitumen surface. |
| Status | Active |
| Observation history | 11-07-2010 - 17-01-2025 |
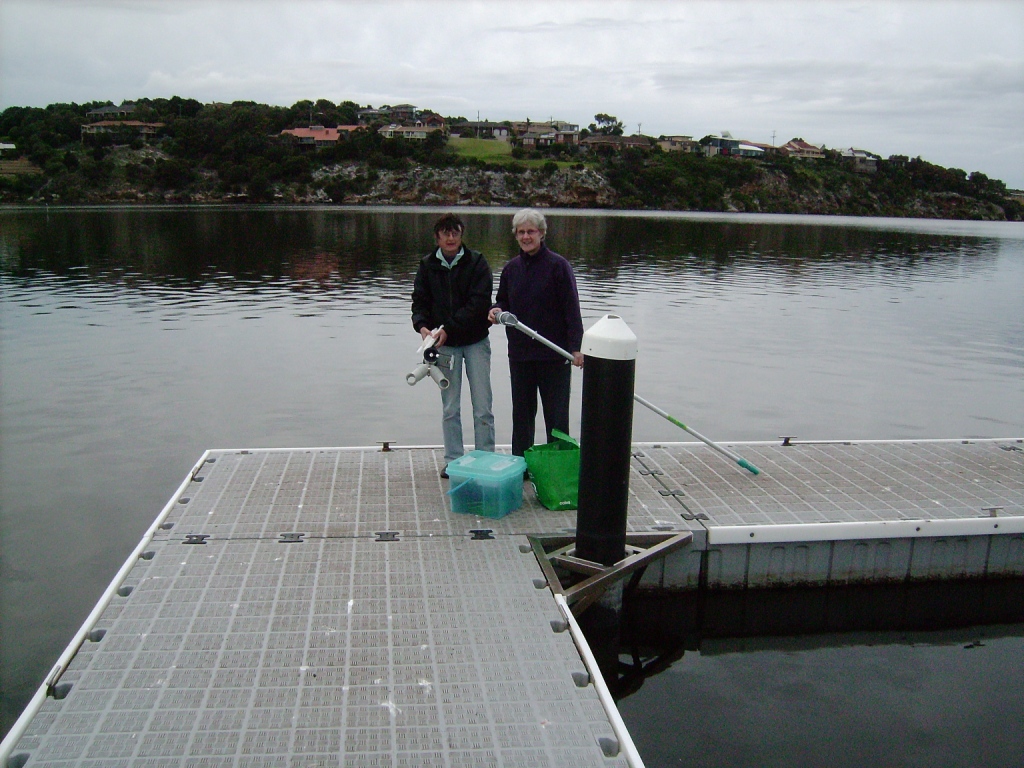
Riverboat Cruise Pontoon |
|
Observations
Turbidity tubes do not measure below 9 NTU; Chart values of 9 should be interpreted as < 9 NTU
Observations
| Date | 16-02-2024 | 15-03-2024 | 20-04-2024 | 25-05-2024 | 22-06-2024 | 21-07-2024 | 17-08-2024 | 21-09-2024 | 21-10-2024 | 15-11-2024 | 13-12-2024 | 17-01-2025 |
|---|---|---|---|---|---|---|---|---|---|---|---|---|
| Observation | #16017 | #16055 | #16121 | #16183 | #16223 | #16331 | #16371 | #16449 | #16520 | #16557 | #16611 | #16659 |
Observation summaries
Turbidity NTU
| 16-02-2024 | 15-03-2024 | 20-04-2024 | 25-05-2024 | 22-06-2024 | 21-07-2024 | 17-08-2024 | 21-09-2024 | 21-10-2024 | 15-11-2024 | 13-12-2024 | 17-01-2025 | |
|---|---|---|---|---|---|---|---|---|---|---|---|---|
| Top | 13.0 | 9.0 | 9.0 | 9.0 | 9.0 | 9.0 | 9.0 | 9.0 | 9.0 | 9.0 | 9.0 | 9.0 |
| Bottom | 52.0 | 9.0 | 9.0 | 10.0 | 9.0 | 9.0 | 10.0 | 9.0 | 9.0 | 12.0 | 11.0 |
pH
| 16-02-2024 | 15-03-2024 | 20-04-2024 | 25-05-2024 | 22-06-2024 | 21-07-2024 | 17-08-2024 | 21-09-2024 | 21-10-2024 | 15-11-2024 | 13-12-2024 | 17-01-2025 | |
|---|---|---|---|---|---|---|---|---|---|---|---|---|
| Top | 7.0 | 7.9 | 7.0 | 8.3 | 8.4 | 8.2 | 8.3 | 8.2 | 8.7 | 8.2 | 8.2 | 8.1 |
| Bottom | 6.9 | 8.0 | 7.5 | 7.9 | 8.2 | 8.0 | 8.1 | 8.3 | 8.0 | 7.9 | 8.1 |
Ammonia mg/L
| 16-02-2024 | 15-03-2024 | 20-04-2024 | 25-05-2024 | 22-06-2024 | 21-07-2024 | 17-08-2024 | 21-09-2024 | 21-10-2024 | 15-11-2024 | 13-12-2024 | 17-01-2025 | |
|---|---|---|---|---|---|---|---|---|---|---|---|---|
| Top | ||||||||||||
| Bottom |
Enterococci orgs/100mL
| 16-02-2024 | 15-03-2024 | 20-04-2024 | 25-05-2024 | 22-06-2024 | 21-07-2024 | 17-08-2024 | 21-09-2024 | 21-10-2024 | 15-11-2024 | 13-12-2024 | 17-01-2025 | |
|---|---|---|---|---|---|---|---|---|---|---|---|---|
| Top | ||||||||||||
| Bottom |
Temperature ° C
| 16-02-2024 | 15-03-2024 | 20-04-2024 | 25-05-2024 | 22-06-2024 | 21-07-2024 | 17-08-2024 | 21-09-2024 | 21-10-2024 | 15-11-2024 | 13-12-2024 | 17-01-2025 | |
|---|---|---|---|---|---|---|---|---|---|---|---|---|
| Top | 22.40 | 21.70 | 16.20 | 12.90 | 11.30 | 11.80 | 15.30 | 13.50 | 20.60 | 21.10 | 22.30 | 24.30 |
| Bottom | 19.70 | 21.20 | 16.30 | 14.40 | 12.80 | 12.50 | 14.10 | 13.30 | 16.60 | 19.00 | 20.60 | 23.60 |
Salinity ppt
| 16-02-2024 | 15-03-2024 | 20-04-2024 | 25-05-2024 | 22-06-2024 | 21-07-2024 | 17-08-2024 | 21-09-2024 | 21-10-2024 | 15-11-2024 | 13-12-2024 | 17-01-2025 | |
|---|---|---|---|---|---|---|---|---|---|---|---|---|
| Top | 17.40 | 19.90 | 13.80 | 7.30 | 7.30 | 13.10 | 11.00 | 16.30 | 8.90 | 9.80 | 12.60 | 9.80 |
| Bottom | 32.00 | 20.00 | 17.30 | 22.00 | 24.60 | 32.30 | 28.20 | 26.30 | 26.20 | 20.40 | 20.80 | 10.00 |
D.O. mg/L
| 16-02-2024 | 15-03-2024 | 20-04-2024 | 25-05-2024 | 22-06-2024 | 21-07-2024 | 17-08-2024 | 21-09-2024 | 21-10-2024 | 15-11-2024 | 13-12-2024 | 17-01-2025 | |
|---|---|---|---|---|---|---|---|---|---|---|---|---|
| Top | 8.48 | 7.41 | 8.75 | 10.29 | 11.35 | 9.46 | 11.39 | 9.39 | 10.29 | 8.86 | 8.28 | 8.41 |
| Bottom | 4.45 | 6.82 | 5.68 | 3.65 | 7.49 | 8.08 | 7.16 | 8.04 | 7.66 | 4.60 | 5.02 | 7.42 |
D.O. % Sat
| 16-02-2024 | 15-03-2024 | 20-04-2024 | 25-05-2024 | 22-06-2024 | 21-07-2024 | 17-08-2024 | 21-09-2024 | 21-10-2024 | 15-11-2024 | 13-12-2024 | 17-01-2025 | |
|---|---|---|---|---|---|---|---|---|---|---|---|---|
| Top | 107.00 | 94.40 | 95.00 | 100.70 | 106.90 | 94.50 | 122.00 | 100.10 | 121.30 | 105.00 | 102.90 | 105.80 |
| Bottom | 58.60 | 85.60 | 63.00 | 39.80 | 81.30 | 92.00 | 82.60 | 91.00 | 90.40 | 55.80 | 62.90 | 91.80 |
Conductivity mS/cm
| 16-02-2024 | 15-03-2024 | 20-04-2024 | 25-05-2024 | 22-06-2024 | 21-07-2024 | 17-08-2024 | 21-09-2024 | 21-10-2024 | 15-11-2024 | 13-12-2024 | 17-01-2025 | |
|---|---|---|---|---|---|---|---|---|---|---|---|---|
| Top | 28.22 | 31.86 | 22.72 | 12.67 | 12.75 | 21.58 | 18.37 | 26.62 | 15.16 | 16.61 | 21.07 | 15.59 |
| Bottom | 48.93 | 32.01 | 28.03 | 34.87 | 38.73 | 49.62 | 43.80 | 41.02 | 40.76 | 32.59 | 32.29 | 16.96 |

All content, files, data and images provided by the EstuaryWatch Data Portal and Gallery are subject to a Creative Commons Attribution License
Content is made available to be used in any way, and should always attribute EstuaryWatch and www.estuarywatch.org.au